Spade Farm
Feature deep-dive
Every dairy has a weather story and almost none of them have weather data. You know it was a hot July. You don't know that intake was still falling two days after the heat broke, how far it fell, or that the conception rate you're unhappy about in October was decided in that same stretch. Weather is one of the few inputs on your farm you can't change — which is exactly why it's worth measuring. You can't move the weather. You can move everything you do about it.
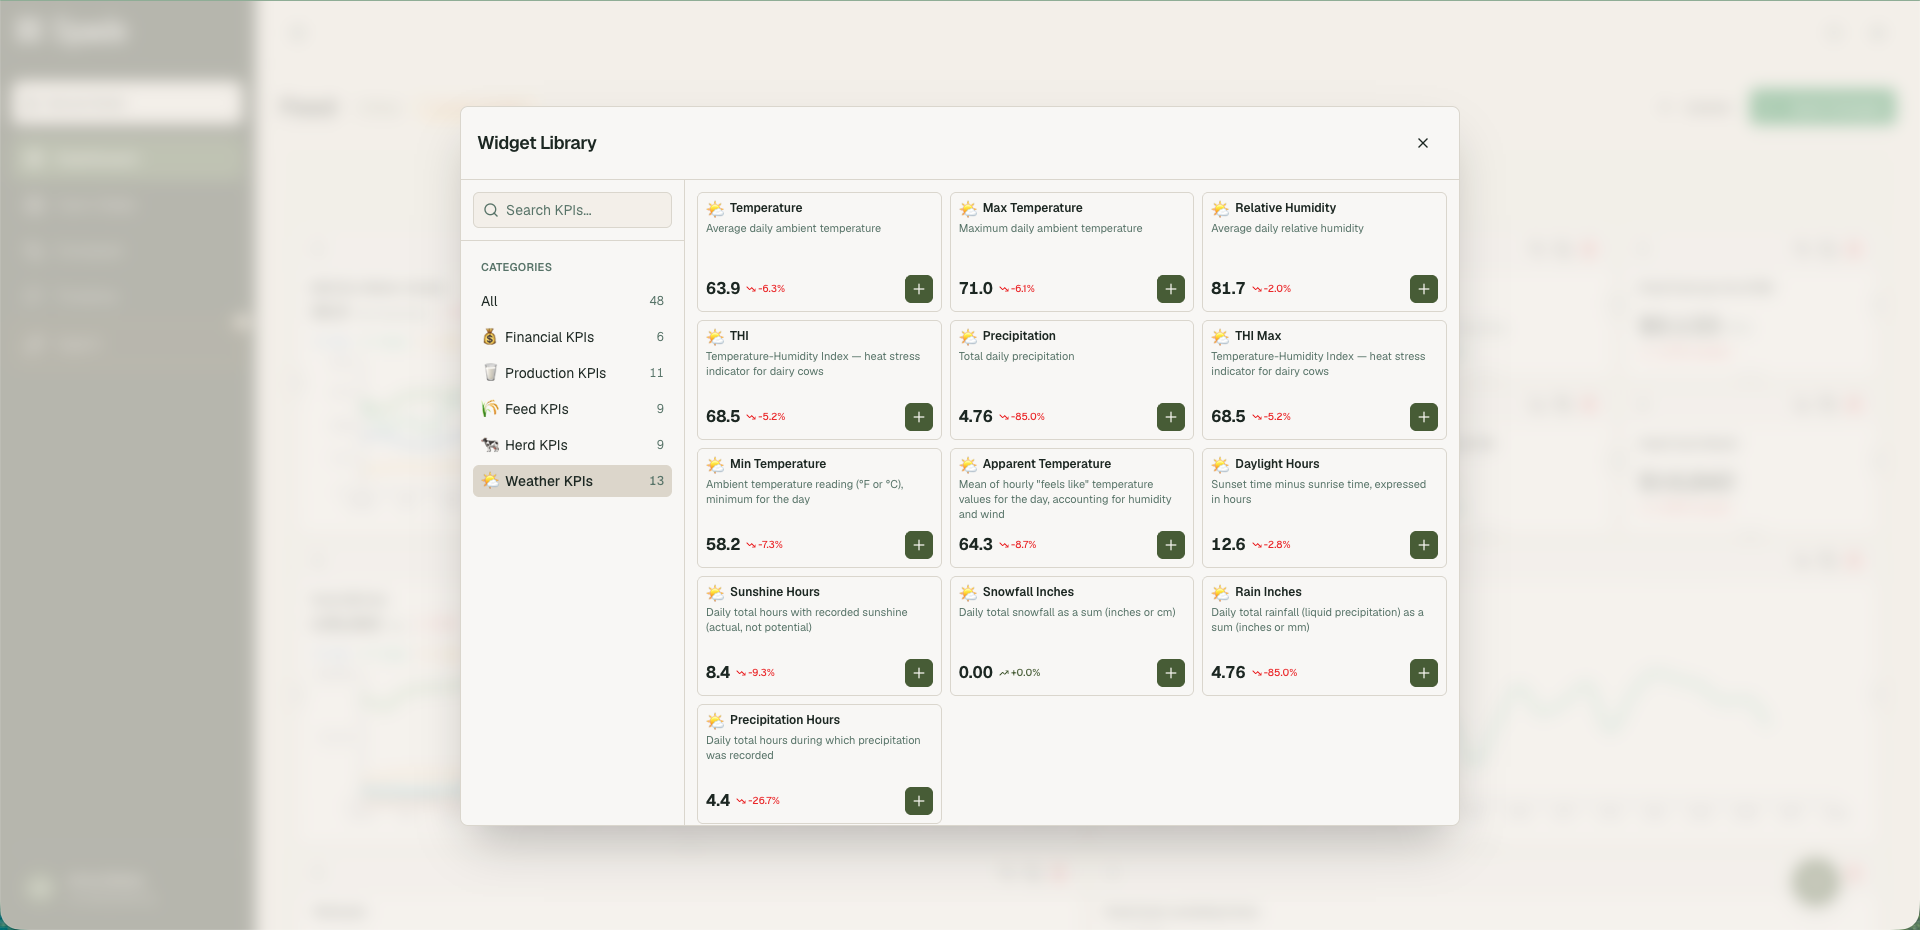
Spade Farm pulls 13 daily weather metrics for your farm's location automatically — no station to buy, no sensor to mount
They sit in the same daily record as your milk, intake, components, SCC and repro numbers, so they can be compared directly
THI is the one to start with: heat stress in high-producing cows begins around THI 68, not the 72 most older references still cite
Weather effects are lagged, not immediate — intake responds in 24–48 hours, SCC in weeks, conception in 40–60 days
The Compare feature is what turns this from a weather report into a management tool
Most farm software treats weather as decoration — a little sun icon in the corner of the dashboard. That's a waste of the most consistently predictive external variable you have.
A dairy is a heat engine. A cow milking 70 lb a day produces about 48% more metabolic heat than a non-lactating cow, and the gap widens as production climbs — taking her from 77 to 100 lb drops her heat-stress threshold temperature by roughly another 9°F. She can't turn the rumen off. Add air temperature, add humidity that shuts down her ability to evaporate, and her only remaining option is to eat less — which is the first thing you see in the data and a key performance change that must be linked to a cause.
Weather also isn't just about cows. It sets your forage harvest windows, your bedding cost, your mud, your manure application days, and the moisture in every load coming off the silage pile that winter.
The value isn't in knowing it was hot. You knew that. The value is in having the number sitting next to your production data on the same day, so that when a KPI moves you can see whether the weather explains it — or whether something else did and you'd have blamed the weather.
Spade Farm collects these daily for your farm's coordinates and stores them in the same farm-day record as everything else. Below, each one: what it is, why a dairy should care, and what to actually do with it.
1. Temperature
2. Max Temperature
3. Min Temperature
4. Relative Humidity
5. THI
6. THI Max
7. Apparent Temperature
8. Daylight Hours
9. Sunshine Hours
10. Precipitation
11. Rain Inches
12. Precipitation Hours
13. Snowfall Inches
average daily ambient temperature
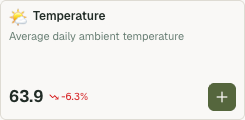
The mean of the day's hourly air temperature readings.
This is your baseline and your context, not your alarm. Daily average smooths away both the afternoon peak that stresses cows and the overnight low that freezes waterers, which makes it the worst of the temperature metrics for triggering action and the best one for seasonal comparison. Use it to answer "was this August hotter than last August," not "should I have run the fans harder on Tuesday."
Track it year over year. When you're comparing two seasons' production, this is the number that tells you whether you're comparing like with like.
the day's high
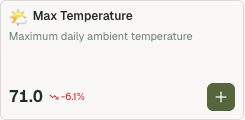
The highest ambient temperature recorded that day.
The peak is where heat abatement either works or doesn't. Cows accumulate heat load through the afternoon and can only shed it when the air gets cooler than they are. A day that averages a comfortable 72°F but peaks at 88°F is a day your cows spent several hours in trouble.
Use max temperature — paired with THI Max below — to audit your cooling. If your fans and soakers are working, high-max days should show up in the weather data and not in the intake data. When they show up in both, the abatement isn't keeping up, and you've just found the ROI case for the next round of fans.
the day's low
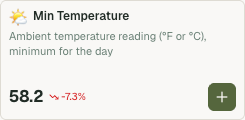
The lowest ambient temperature recorded that day.
Two completely separate jobs, one at each end of the year.
In summer, the overnight low is the recovery window. Work on desert-climate herds (Igono et al., 1992) found that hours spent below about 70°F overnight provide the margin of safety that limits heat-stress losses — the more of them, the smaller the hit. A night that never drops below 75°F means she starts tomorrow already behind, and the effects compound across consecutive days.
In winter, the low sets your freeze risk and your labor. It's the number behind frozen waterers — and water restriction is the fastest route to a milk drop there is — plus frozen bunk faces and teat frostbite.
Set it as your morning walk-through trigger in both directions. A hot night means check whether cows had any recovery window at all. A cold night means waterers first, then teat condition, then the bunk.
average daily
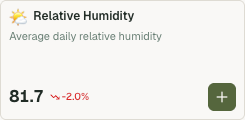
The average percentage of moisture the air is holding relative to what it could hold at that temperature.
Humidity is the difference between hot and dangerous. Above her upper critical temperature, a cow's only remaining cooling route is evaporation — sweating and panting. Evaporation depends on the moisture gradient between her wet surface and the air. When humidity is high, that gradient closes and the last cooling pathway shuts.
The practical size of this is bigger than most people assume. At the same 85°F air temperature, a dry-climate herd at 20% humidity sits at THI 73 — mild. A humid-climate herd at 80% sits at THI 82 — moderate to severe. Same thermometer reading, nine THI units apart.
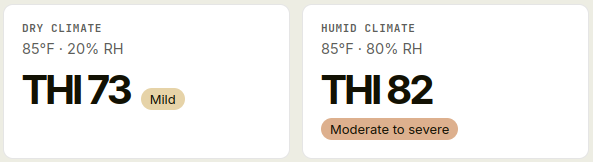
If you're in a humid region, stop using air temperature as your trigger. It will consistently understate what your cows are experiencing. Use THI.
Temperature-Humidity Index
A single index combining air temperature and relative humidity into one heat-stress number. The formula most used in US dairy comes from NRC (1971):
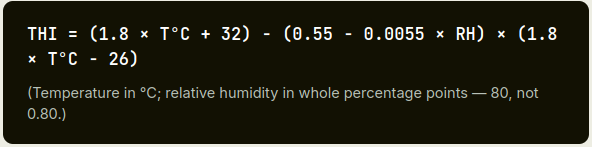
This is the closest thing the industry has to a shared language for heat stress, and it's one of the best weather metrics to overlay against key performance metrics.
Commonly used bands, with the caveat that boundaries vary by source: under 68 no stress, 68–71 mild, 72–79 mild to moderate, 80–89 moderate to severe, 90 and above severe.

Published estimates of milk loss per THI unit above threshold range from about 0.4 to 0.9 lb/cow/day, because studies differ in how they handle lag and which threshold they use. Take the range, not any single number. The Arizona work puts the gap between a minimum THI of 65 and 73 at roughly 4.9 lb/cow/day. That is real money at any milk price.
Make THI, not temperature, the number your heat plan is written against. And make it the first thing you compare against intake.
the day's peak heat stress
The highest THI value reached during the day.
A daily average hides both the peak and how long it lasted, and duration turns out to be the better predictor. Research going back to the early nineties found that the total number of hours above a THI threshold, summed across several days, correlated with milk yield better than any daily average did. More recent work on cumulative "THI-days" reached the same conclusion: models that ignore accumulated heat load systematically understate the damage.
This is also why the same daily-average THI can mean two very different things. A day that hovers at 70 all day and a day that swings between 60 and 82 can produce the same average. The second one is far worse.
Watch the spread between THI and THI Max. A wide gap with a cool night is survivable. A narrow gap at a high level — where average and max are both elevated — means there was no recovery window, and that's the pattern that stacks across consecutive days into a production loss you'll see for a week.
“feels like”
The mean of the day's hourly heat index values. Heat index combines air temperature and relative humidity into a single measure of human heat stress.
Apparent temperature uses the National Weather Service heat index formula, which is calibrated to human physiology. It does not account for the heat load a cow generates through rumen fermentation, and it is not a substitute for THI. Both are reported in degrees, but the two scales measure different things and are not interchangeable.
Apparent temperature is most useful for labor planning. It helps assess conditions in the parlor and holding pen, decide when to add break rotations, and identify when heavy work in the feed alley or on the silage pile becomes a safety concern. OSHA bases its heat illness guidance on the heat index, so the same value applies to a milking crew working an 8-hour shift in a hot holding area.
Published heat index values assume shaded conditions. Direct sun can raise the effective value by up to 15°F. This applies to crews working on the silage pile and to cattle in unshaded lots.
Use apparent temperature to schedule labor and to support decisions about shade in the holding area. Use THI for cow-related decisions.
sunrise to sunset
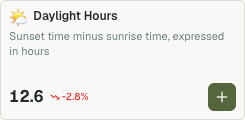
The astronomical day length for your location, calculated as sunset minus sunrise.
Day length shows how much natural light is available on a given date and how that changes across the year. The metric measures outdoor conditions only. It does not reflect the light cows receive inside the barn, which depends on building design, curtain and ridge openings, and any supplemental lighting.
Photoperiod affects both milking and dry cows, and the two groups respond best to different light patterns. Because barn lighting is not measured here, use day length to understand the natural baseline rather than to estimate what cows are experiencing.
Use day length to see how much supplemental lighting is needed in each season. In December and January, when natural days in northern regions drop to about 9 hours, most of a lighting program's hours come from artificial light. In June, natural daylight covers much of the day.
Use it as a timing reference for reviewing lighting schedules. Timers set for summer day length may not match winter conditions, and the reverse is also true.
Use caution when attributing seasonal milk trends to day length. Day length, temperature, and calving pattern change together on the same annual cycle, so a single farm's year-over-year data cannot separate their effects. To evaluate a lighting change, compare two similar pens during the same period instead of comparing this year to last year.
actual recorded sunshine
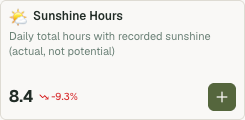
Daily hours of measured direct sunshine. This differs from day length. A 14-hour day with 4 hours of sunshine was mostly overcast.
Sunshine hours affect two areas of the operation: heat load on cattle and forage drying.
Heat load on cattle: THI does not account for sunshine. Cattle in direct sun absorb solar radiation in addition to the heat measured by temperature and humidity, so the actual heat load on a sunny day is higher than THI indicates. Shade reduces this added load substantially and is one of the lowest-cost forms of heat abatement. On days with high sunshine hours, cattle without access to shade carry more heat stress than cattle in shaded or housed areas.
Forage drying: Solar radiation is the main driver of hay dry-down. In full sun, hay can be ready to bale in about a day and a half. Under overcast conditions, drying can take several days, even without rain. Low sunshine hours explain why a cutting can stay wet despite a dry forecast.
Use sunshine hours alongside THI when reviewing a hot period. If cattle responded more strongly than THI suggested, high sunshine hours may account for the difference, particularly for groups with limited shade.
Use sunshine hours when reviewing forage harvests. If a cutting took longer to dry or lost quality, check sunshine hours for the days between mowing and baling.
total daily precipitation
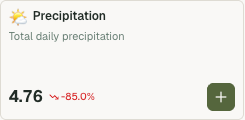
Total precipitation in all forms, liquid equivalent.
Precipitation is the total of all forms (rain, snow, sleet) for the day. For feeding, it matters because rain and snow add water to feed ingredients stored or handled in the open, including the bunker or pile face, bagged silage at the open end, uncovered bales, and wet byproducts such as distillers grains or brewers grains.
When ingredients take on water, their dry matter percentage drops. A ration mixed to the same as-fed weights then delivers less dry matter than formulated, which lowers dry matter intake. The mix can also be less consistent from load to load if moisture varies across the pile face or storage area.
Wetter rations can also affect the feed bunk. A wet TMR can heat and spoil faster, especially in warm weather, and cows may sort or refuse it. This shows up as higher refusals and a gap between feed delivered and feed consumed.
Use precipitation totals to decide when to recheck forage and byproduct dry matter. After a significant rain or snow event, test DM on exposed ingredients and adjust as-fed amounts so the ration delivers the intended dry matter.
Use it when reviewing changes in DMI, refusals, or milk. If intake dropped or refusals rose, check whether the change followed a precipitation event and whether as-fed amounts were adjusted.
Use it to evaluate feed storage and handling. Repeated DM shifts after precipitation point to ingredients that may need cover or a different storage location.
liquid precipitation only
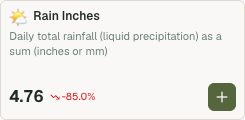
Daily rainfall as liquid, separated from frozen precipitation.
For housed cattle, rain affects bedding and feed before either reaches the cows.
Bedding: Bedding stored outdoors or under partial cover, such as sand, sawdust, straw, or recycled manure solids, absorbs rain. Wet bedding delivered to stalls stays wet longer, supports faster bacterial growth, and reduces lying time. Cows avoid wet stalls when dry ones are available, and less time lying down is associated with lower milk yield and more lameness. Higher bacterial load in bedding increases mastitis risk.
Feed: Rain adds water to exposed feed ingredients, including the bunker or pile face, the open end of silage bags, uncovered bales, and wet byproducts. This lowers ingredient dry matter, so a ration mixed to the same as-fed weights delivers less dry matter than formulated.
Forage harvest: Rain on hay that is drying in the field causes dry matter and quality losses. Losses are greater when rain falls on hay that is nearly dry than on freshly cut hay. Rain during harvest can also create moisture variation in stored silage, which shows up months later as inconsistent dry matter across the bunker face.
Use rain totals to identify when stored bedding may be wet. After significant rain, check bedding moisture before delivery and compare rain events against SCC, clinical mastitis, and stall use.
Use rain totals to decide when to retest dry matter on exposed feed ingredients and adjust as-fed amounts.
Use harvest-period rain totals when reviewing forage quality and dry matter variability later in the feeding season.
how long it rained
Total hours during the day in which precipitation was recorded. This measures duration, not volume.
Precipitation hours show how much of the day was affected by wet conditions, which is different from how much precipitation fell. A day with light rain spread over 10 hours limits work and keeps conditions damp longer than a day with the same total falling in one hour.
Workable hours: Precipitation hours indicate how much of the day was available for outdoor work, including fieldwork, forage harvest, manure hauling and application, bedding and feed handling, and work at the bunker or pile face. Several days of long-duration light rain can cause more lost work time than a single heavy event, even when total inches are lower.
Humidity: Long periods of precipitation keep relative humidity high and slow drying. In the barn, this means bedding, stalls, alleys, and udders stay wet longer, and ventilation has to remove more moisture to keep conditions dry. Persistent damp conditions increase bacterial growth in bedding and can contribute to higher SCC, mastitis, and hoof problems. High humidity during warm weather also raises THI and adds to heat stress. Outside the barn, extended humidity slows dry-down of stored bedding and forage in the field.
Use precipitation hours to explain lost work days and to plan field and manure work around extended wet periods.
Use precipitation hours alongside total inches when reviewing SCC, mastitis, or lameness trends. A month with average rainfall totals but high precipitation hours may still have kept bedding and stalls wet.
Use precipitation hours to evaluate ventilation performance during extended wet periods. If barn conditions stay damp, check airflow and moisture removal.
daily snowfall total
Daily snowfall as a sum.
For housed cattle, snowfall mainly affects logistics: getting people, feed, milk, and supplies where they need to be on schedule.
Labor: Heavy snow can delay or prevent employees from reaching the farm. Snow removal also takes labor and equipment time away from regular chores, which can push back milking, feeding, and cleaning schedules.
Feeding: Snow can block access to the bunker or pile face, bale storage, and commodity sheds. Snow removal at the feed center, along with drifting across drive paths, can delay feed mixing and delivery. Late or inconsistent feeding times affect intake and bunk management. Snow that gets onto the pile face or into the mixer also adds moisture to the ration.
Milk pickup and deliveries: Milk trucks need a clear, safe route to the milkhouse. If a truck cannot reach the farm, milk may exceed tank capacity and have to be dumped. Feed, bedding, fuel, and other deliveries can also be delayed.
Manure and bedding: Snow can limit access to manure storage, slow scraping and hauling in outdoor areas, and delay bedding delivery to barns.
Buildings: Snow accumulation adds roof load. Wet, dense snow weighs several times more than light snow at the same depth, and drifting creates uneven loads that increase collapse risk.
Use snowfall totals and forecasts to plan snow removal, staff coverage, and feed mixing ahead of a storm. Keep priority routes clear to the feed center, milkhouse, and manure storage.
Coordinate with the milk hauler and suppliers when heavy snow is expected, and confirm bulk tank capacity in case pickup is delayed.
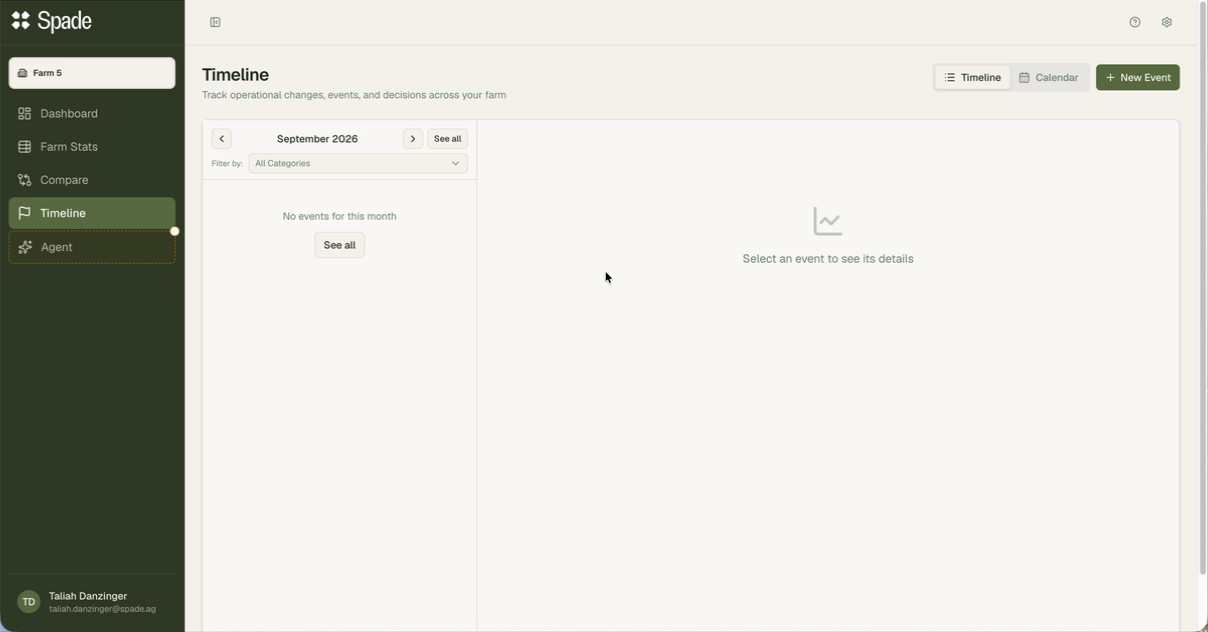
Individually, these metrics are a weather report. Compared against your production data, they're a management tool. That's what Compare does: it puts any weather metric and any farm KPI on the same chart, over the same dates, at the same daily grain.A worked example. Here's a 30-day window from our demonstration herd, with dry matter intake and THI plotted together.
Nutrition & Feed
Ration Change
"New crop corn silage"
September 13

Through most of the month, THI and intake follow a steady pattern: THI in the mid-60s and intake holding steady. Then a hot, humid stretch arrives. THI rises into the high 70s and stays there for most of a week, and overnight lows stay high enough that cows get little relief. Intake drops sharply.
This pattern shows three things beyond the fact that heat reduces intake.
Timing of the response. Intake can start falling on the hot day, but the largest effect on intake and milk usually appears 24 to 48 hours later. To judge whether cooling worked, look at intake and milk one to two days after the heat, not the same day.
Recovery. Watch how quickly intake returns after the heat breaks. A fast recovery suggests the cooling system was adequate and was pushed past capacity by an unusual stretch. A slow recovery suggests cows carried more heat load than the daily THI average shows. In that case, review THI Max and overnight lows. Recovery speed also depends on how long the heat lasted, stage of lactation, and production level.
Delayed costs. The drop in intake is not the largest cost of a heat event. Heat stress also affects the herd over the following weeks, months, and into the next generation.
It narrows the list of suspects. When milk is off and you have a timeline, you're choosing between four logged changes instead of guessing across an entire quarter.
It narrows the list of suspects. When milk is off and you have a timeline, you're choosing between four logged changes instead of guessing across an entire quarter.
It narrows the list of suspects. When milk is off and you have a timeline, you're choosing between four logged changes instead of guessing across an entire quarter.
Somatic cell count
weeks
Heat stress weakens immune function and increases exposure to environmental pathogens. Bulk tank SCC generally peaks in late summer. Compare SCC against THI from several weeks earlier; three weeks is a reasonable starting point.
One thing we want to say plainlyConception rate
immediately and 40 to 60 days later
Heat reduces fertility right away through weaker estrus expression and higher early embryonic loss. It also damages follicles that are still developing. A follicle takes about six weeks to grow from the early antral stage to ovulation, and heat effects on the oocyte can carry over for two to three estrous cycles. As a result, conception rates stay low for 40 to 60 days after the weather cools. This is a major contributor to lower fall conception rates and a reason to keep cooling running into September. Compare conception rate against THI from about six weeks earlier.
One thing we want to say plainly
a year or more
Dry cows exposed to heat stress produce an average of 10 lb/day less milk in the following lactation. Their daughters, exposed to heat in utero, produce about 5.1 kg/day (roughly 11 lb/day) less milk in their first lactation. They are also less likely to survive to first calving: 71% compared with 83% for daughters of cooled dams. Lower milk yield in these daughters continues for at least three lactations. Dry cow cooling is a high-return investment, and its benefits do not appear in same-season data.
None of this is new science. What's new is being able to put your own two lines next to each other and see it on your own farm, rather than reading it in a paper about somebody else's.
Comparisons worth running first:
[List pending from copy — comparisons to run first.]
A guide that only sells the upside isn't much use. Three honest limits:
It takes temperature and humidity — nothing else. Adjusted versions from feedlot research suggest each meter per second of wind is worth roughly 2 THI units, and full sun versus overcast is worth about 5. A shaded, well-ventilated barn at THI 74 and a still, sunlit dry lot at THI 74 are not the same environment, and the gap can run 5 to 10 effective units.
These readings come from weather data for your farm's coordinates. Inside a well-ventilated barn with fans and soakers running, conditions are meaningfully better than the outside reading. That's the point — the difference between the outside number and what your cows actually experience is your abatement performance, and it's the most useful way to read this data. But don't mistake the regional reading for a barn sensor.
Daylength, temperature and calving distribution move together every single year. Your own historical data can show you the pattern; it cannot, on its own, tell you which of the three caused it.
The Temperature-Humidity Index combines air temperature and relative humidity into a single heat-stress number. For modern high-producing dairy cows, heat stress begins around THI 68. Roughly: under 68 no stress, 68–71 mild, 72–79 mild to moderate, 80–89 moderate to severe, 90 and above severe. Band boundaries vary somewhat between published sources.
No. Spade Farm pulls weather data for your farm's coordinates automatically. There's nothing to buy and nothing to mount. If you already run an on-farm station, talk to us about connecting it.
Intake and milk respond 24 to 48 hours after the heat event, not the same day. SCC and mastitis pressure build over weeks. Conception rate reflects heat stress from 40 to 60 days earlier. Different numbers on different clocks — which is exactly why comparing them on the same chart is useful.
Because the follicle ovulating today spent the previous 40 to 50 days developing — through the heat. Fertility doesn't recover when the weather breaks; it recovers roughly six weeks later. It's the main reason to keep cooling running well past the last hot week.
Less than most people assume, for a modern herd in a well-bedded, wind-protected freestall. The evidence for direct cold-related yield loss comes largely from older work on much lower-producing cows in uninsulated housing. Losses in a cold snap are far more likely to come from frozen waterers, restricted feed access, and frostbite-related mastitis than from the cow's own heat balance. Calves are a different story entirely — their lower critical temperature is far higher.
Precipitation inches measure volume. Use inches to anticipate changes in feed ingredient dry matter, which affect TMR mixing, dry matter intake, and refusals. Precipitation hours measure duration. Use hours to assess how much of the day was workable and how long humidity stayed high, which affects bedding and stall dry-down, udder hygiene, and SCC. Light rain spread over many hours can limit work and keep conditions damp longer than the same total falling in a short period.
Yes — that's what Compare is for. Any weather metric and any farm KPI, on one chart, over the same dates.
It depends on herd size, how many systems you're connecting, and what you need beyond the core four data sources. It's a short conversation, not a form — talk to our team and we'll quote your operation.
Your Spade contact can pull your farm's THI history against your own intake, milk and conception data and walk through it with you.
Advise dairies for a living? Nutritionists, vets and consultants use Spade Consultant to run the same comparisons across every client herd — same units, same calculations, one place.